Exhibit 10-7 Aggregate supply and demand curves 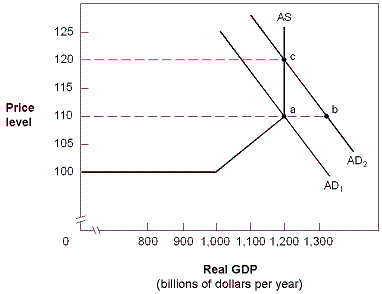 In Exhibit 10-7, the aggregate demand and supply curves reflect an economy in which:
A) full employment is at $1,000 billion GDP.
B) excess aggregate supply is created when there is a shift from AD1 to AD2.
C) excess aggregate demand forces prices up to P = 120.
D) excess aggregate demand causes prices to stabilize at P = 110.
E) a new equilibrium is found at point b.
Correct Answer:
Verified
Q133: When the economy is experiencing high inflation
Q137: Cost-push inflation occurs when the:
A) aggregate demand
Q138: Exhibit 10-3 Aggregate supply and demand curves
Q139: Exhibit 10-4 Aggregate supply and demand curves
Q141: Exhibit 10-6 Aggregate supply curve 
Q143: Exhibit 10-6 Aggregate supply curve
Q144: Exhibit 10-6 Aggregate supply curve
Q145: Exhibit 10-8 Aggregate demand and supply
Q146: Exhibit 10-8 Aggregate demand and supply
Q147: Exhibit 10-8 Aggregate demand and supply
Unlock this Answer For Free Now!
View this answer and more for free by performing one of the following actions

Scan the QR code to install the App and get 2 free unlocks

Unlock quizzes for free by uploading documents