Exhibit 6 Aggregate demand and supply model 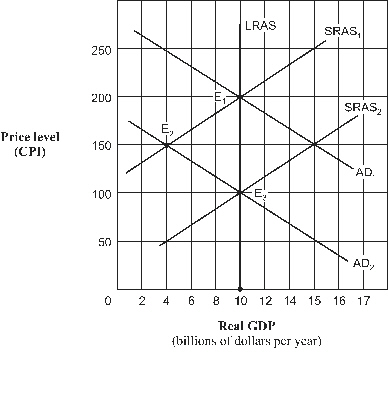 As shown in Exhibit 6, and assuming the aggregate demand curve shifts from AD1 to AD2, the full-employment level of real GDP is:
A) $10 billion.
B) $4 billion.
C) $100 billion.
D) unable to be determined.
Correct Answer:
Verified
Q68: In Exhibit 4, point P2, Y1 represents:
A)that
Q69: In Exhibit 3, the intersection of AD
Q70: Beginning from long-run equilibrium at point E1
Q71: Beginning from short-run equilibrium at point E2
Q72: Economic growth is represented in Exhibit 5
Q74: In Exhibit 2, the short-run equilibrium depicts
Q75: Exhibit 5 Macro AD-AS Model 
Q76: Beginning in Exhibit 5 from long-run equilibrium
Q77: In Exhibit 3, the level of real
Q78: Exhibit 2 Macro AD-AS Model
Unlock this Answer For Free Now!
View this answer and more for free by performing one of the following actions

Scan the QR code to install the App and get 2 free unlocks

Unlock quizzes for free by uploading documents