Exhibit 11-1 Disposable income and consumption data 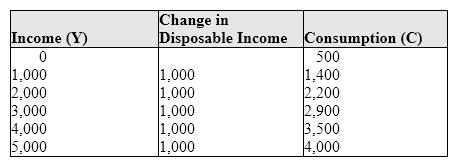 In Exhibit 11-1, when disposable income is increased from $2,000 to $3,000 to $4,000,
A) total consumption increases by $1,000.
B) the marginal propensity to consume remains constant.
C) the marginal propensity to consume increases from 0.6 to 0.7.
D) the marginal propensity to consume decreases from 0.8 to 0.7.
E) the marginal propensity to consume decreases from 0.7 to 0.6.
Correct Answer:
Verified
Q45: The sum of the marginal propensity to
Q48: The marginal propensity to consume measures the
Q49: The marginal propensity to consume is:
A) the
Q58: The ratio of a change in consumption
Q59: The change in consumption divided by a
Q70: The marginal propensity to save is
A)the change
Q71: Exhibit 11-3 Aggregate demand and supply model
Q74: Exhibit 11-2 Aggregate demand and supply model
Q102: If the marginal propensity to consume =
Q111: The marginal propensity to save is:
A)the change
Unlock this Answer For Free Now!
View this answer and more for free by performing one of the following actions

Scan the QR code to install the App and get 2 free unlocks

Unlock quizzes for free by uploading documents