Exhibit 11-1 Disposable income and consumption data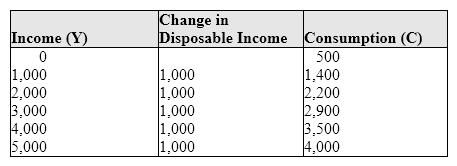 In Exhibit 11-1, when disposable income (Y) is increased from $0 to $1,000 to $2,000, the marginal propensity to consume:
A) is 1.
B) decreases from 0.9 to 0.8.
C) decreases from 0.8 to 0.7.
D) increases from 0.8 to 0.9.
E) is negative.
Correct Answer:
Verified
Q30: The spending multiplier is defined as:
A) the
Q39: If your income increases from $30,000 to
Q60: The marginal propensity to consume (MPC)is computed
Q63: Exhibit 11-3 Aggregate demand and supply model
Q64: Exhibit 11-1 Disposable income and consumption data
Q65: The change in saving divided by the
Q66: The marginal propensity to save (MPS)is computed
Q71: If MPC = 0.9, equilibrium real GDP
Q76: If the MPC = .75, the spending
Q108: The relationship between MPC and MPS is:
A)1
Unlock this Answer For Free Now!
View this answer and more for free by performing one of the following actions

Scan the QR code to install the App and get 2 free unlocks

Unlock quizzes for free by uploading documents