Exhibit 17-1 Inflation and unemployment rates 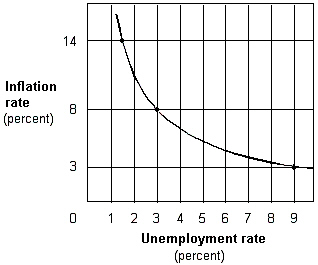 The graph in Exhibit 17-1 indicates a(n) :
A) direct relationship.
B) quadratic relationship.
C) exponential relationship.
D) inverse relationship.
E) hyperbolic relationship.
Correct Answer:
Verified
Q12: Under the natural rate hypothesis, expansionary monetary
Q19: The Phillips curve relates the inflation rate
Q20: The Phillips curve shows a negative relationship
Q21: Exhibit 17-1 Inflation and unemployment rates
Q22: The inverse trade-off between inflation and unemployment
Q23: The Phillips curve:
A)was relatively well-defined during the
Q26: If the long-run Phillips curve is vertical,
Q27: The long-run Phillips curve is a(n)_ line
Q28: Exhibit 17-1 Inflation and unemployment rates
Q29: Which economist(s)first identified an inverse relationship between
Unlock this Answer For Free Now!
View this answer and more for free by performing one of the following actions

Scan the QR code to install the App and get 2 free unlocks

Unlock quizzes for free by uploading documents