Exhibit 17-3 Aggregate demand and aggregate supply curves 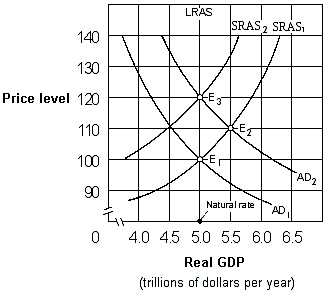 As shown in Exhibit 17-3, if people behave according to adaptive expectations theory, an increase in the aggregate demand curve from AD1 to AD2 will cause the price level to move:
A) from 100 to 110 initially and then eventually move back to 100.
B) directly from 100 to 110 and then remain at 110.
C) directly from 100 to 120 and then remain at 120.
D) from 100 to 110 initially and then eventually move to 120.
Correct Answer:
Verified
Q92: Exhibit 17-2 Aggregate demand and aggregate supply
Q93: The Phillips curve represents an inverse relationship
Q94: During the 1960s, the inflation rate and
Q95: Exhibit 17-2 Aggregate demand and aggregate supply
Q96: Exhibit 17-5 Short-run and long-run Phillips curve
Q98: Which of the following is not an
Q99: Exhibit 17-4 Short-run and long-run Phillips curves
Q100: Exhibit 17-3 Aggregate demand and aggregate supply
Q101: A preannounced contractionary money policy is more
Q102: The long-run Phillips curve is a vertical
Unlock this Answer For Free Now!
View this answer and more for free by performing one of the following actions

Scan the QR code to install the App and get 2 free unlocks

Unlock quizzes for free by uploading documents