Figure 2-15
Relationship between Price and Cups of Coffee
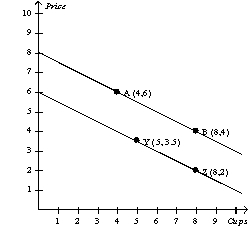
-Refer to Figure 2-15.The slope of the line containing points Y and Z is
A) -0.5.
B) -1.
C) -2.
D) -4.
Correct Answer:
Verified
Q49: A relatively flat demand curve indicates that
A)quantity
Q64: Alfonso has noticed that increases in unemployment
Q391: Figure 2-17
Relationship Between Years of Education and
Q392: Figure 2-16
In the following graph the x-axis
Q393: Figure 2-15
Relationship between Price and Cups of
Q394: Figure 2-15
Relationship between Price and Cups of
Q396: Figure 2-15
Relationship between Price and Cups of
Q397: Figure 2-15
Relationship between Price and Cups of
Q399: Figure 2-15
Relationship between Price and Cups of
Q400: Figure 2-17
Relationship Between Years of Education and
Unlock this Answer For Free Now!
View this answer and more for free by performing one of the following actions

Scan the QR code to install the App and get 2 free unlocks

Unlock quizzes for free by uploading documents