Figure 6-5 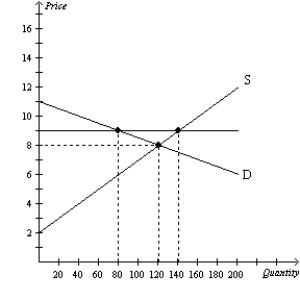
-Refer to Figure 6-5. Suppose the market is initially in equilibrium. Then the government imposes a price control, as represented by the horizontal line on the graph. If the price control is a price floor, then the price control
A) causes the quantity demanded to decrease by 50 units, relative to the initial equilibrium.
B) causes the quantity supplied to increase by 40 units, relative to the initial equilibrium.
C) results in some firms being more successful than others in selling their goods.
D) All of the above are correct.
Correct Answer:
Verified
Q91: Figure 6-6 Q104: Figure 6-9 Q108: Figure 6-6 Q114: Figure 6-7 Q118: Figure 6-6 Q119: Figure 6-7 Q121: Figure 6-8 Q125: Figure 6-12 Q131: Figure 6-13 Q133: Figure 6-9 Unlock this Answer For Free Now! View this answer and more for free by performing one of the following actions Scan the QR code to install the App and get 2 free unlocks Unlock quizzes for free by uploading documents![]()
![]()
![]()
![]()
![]()
![]()
![]()
![]()
This figure shows the market demand![]()

