Figure 8-7
The vertical distance between points A and B represents a tax in the market.
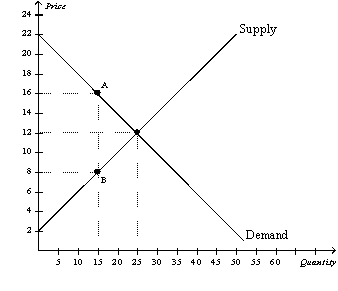
-Refer to Figure 8-7.The deadweight loss associated with this tax amounts to
A) $60, and this figure represents the amount by which tax revenue to the government exceeds the combined loss of producer and consumer surpluses.
B) $60, and this figure represents the surplus that is lost because the tax discourages mutually advantageous trades between buyers and sellers.
C) $40, and this figure represents the amount by which tax revenue to the government exceeds the combined loss of producer and consumer surpluses.
D) $40, and this figure represents the surplus that is lost because the tax discourages mutually advantageous trades between buyers and sellers.
Correct Answer:
Verified
Q145: Figure 8-6
The vertical distance between points A
Q148: Figure 8-6
The vertical distance between points A
Q152: Figure 8-8
Suppose the government imposes a $10
Q162: Scenario 8-1
Erin would be willing to pay
Q162: Figure 8-8
Suppose the government imposes a $10
Q163: Scenario 8-2
Tom mows Stephanie's lawn for $25.
Q164: Figure 8-8
Suppose the government imposes a $10
Q166: Figure 8-8
Suppose the government imposes a $10
Q167: Figure 8-8
Suppose the government imposes a $10
Q168: Figure 8-7
The vertical distance between points A
Unlock this Answer For Free Now!
View this answer and more for free by performing one of the following actions

Scan the QR code to install the App and get 2 free unlocks

Unlock quizzes for free by uploading documents