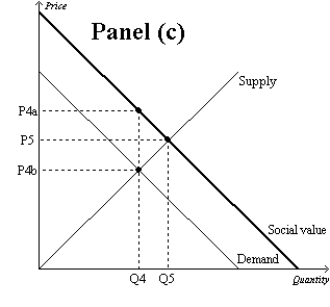
Figure 10-9 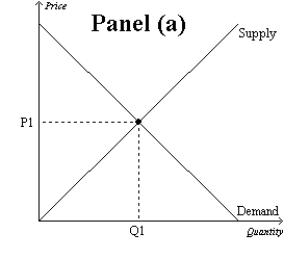
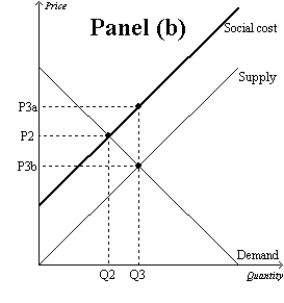
-Refer to Figure 10-9, Panel (b) . The market equilibrium quantity is
A) Q2, which is the socially optimal quantity.
B) Q3, which is the socially optimal quantity.
C) Q2, and the socially optimal quantity is Q3.
D) Q3, and the socially optimal quantity is Q2.
Correct Answer:
Verified
Q158: If the production of computer chips yields
Q363: Which of the following is NOT a
Q364: Figure 10-9 Q366: Technology spillover occurs when Q367: When technology spillover occurs, Q369: When an industry is characterized by technology![]()
A)a firm passes the
A)it is the government's
Unlock this Answer For Free Now!
View this answer and more for free by performing one of the following actions

Scan the QR code to install the App and get 2 free unlocks

Unlock quizzes for free by uploading documents