Figure 13-10
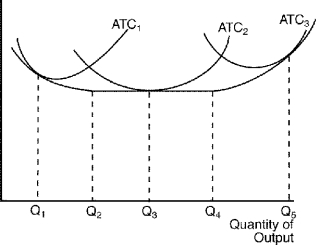
-Refer to Figure 13-10.The three average total cost curves on the diagram labeled ATC₁,ATC₂,and ATC₃ most likely correspond to three different
A) time horizons.
B) products.
C) firms.
D) factory sizes.
Correct Answer:
Verified
Q8: The economic field of industrial organization examines
Q18: Economic profit is greater than or equal
Q85: In his book, An Inquiry into the
Q143: Figure 13-9
The figure below depicts average total
Q144: Figure 13-9
The figure below depicts average total
Q275: Figure 13-9
The figure below depicts average total
Q436: In the long run Firm A incurs
Q439: In the long run Firm A incurs
Q441: Table 13-15
Consider the following table of long-run
Q445: Table 13-15
Consider the following table of long-run
Unlock this Answer For Free Now!
View this answer and more for free by performing one of the following actions

Scan the QR code to install the App and get 2 free unlocks

Unlock quizzes for free by uploading documents