Figure 16-2
This figure depicts a situation in a monopolistically competitive market.
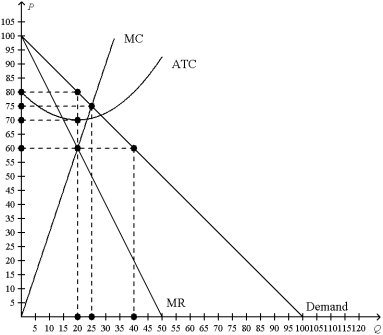
-Refer to Figure 16-2.At the profit-maximizing level of output,what is this firm's total cost of production?
A) $1,200
B) $1,400
C) $1,600
D) $1,875
Correct Answer:
Verified
Q145: Figure 16-2
This figure depicts a situation in
Q146: Figure 16-2
This figure depicts a situation in
Q147: Figure 16-4 Q148: Figure 16-3 Q149: Figure 16-4 Q151: Figure 16-3 Q153: Figure 16-2 Q154: Figure 16-2 Q191: Figure 16-2 Q195: Figure 16-3 Unlock this Answer For Free Now! View this answer and more for free by performing one of the following actions Scan the QR code to install the App and get 2 free unlocks Unlock quizzes for free by uploading documents
![]()
![]()
![]()
![]()
This figure depicts a situation in
This figure depicts a situation in
This figure depicts a situation in![]()

