Figure 16-8
The figure is drawn for a monopolistically-competitive firm.
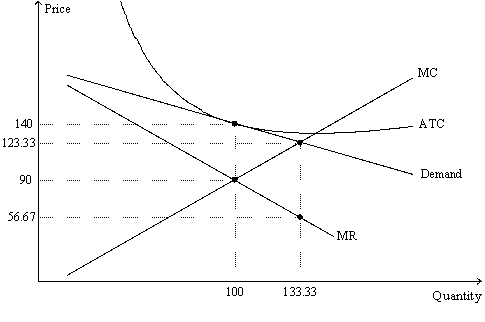
-Refer to Figure 16-8.The quantity of output at which the MC and ATC curves cross is the
A) efficient scale of the firm.
B) short-run equilibrium quantity of output for the firm.
C) long-run equilibrium quantity of output for the firm.
D) All of the above are correct.
Correct Answer:
Verified
Q252: Figure 16-9
The figure is drawn for a
Q253: Figure 16-8
The figure is drawn for a
Q255: Figure 16-8
The figure is drawn for a
Q258: Figure 16-9
The figure is drawn for a
Q259: Figure 16-8
The figure is drawn for a
Q260: Figure 16-9
The figure is drawn for a
Q261: A monopolistically competitive firm has the following
Q296: Figure 16-9
The figure is drawn for a
Q408: When a firm operates with excess capacity,
A)additional
Q409: Consider monopoly, monopolistic competition, and perfect competition.
Unlock this Answer For Free Now!
View this answer and more for free by performing one of the following actions

Scan the QR code to install the App and get 2 free unlocks

Unlock quizzes for free by uploading documents