Figure 18-7
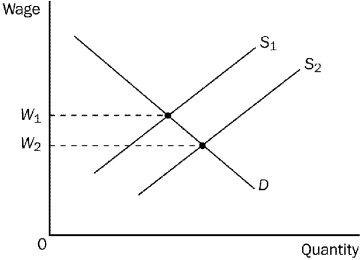
-Refer to Figure 18-7.Assume W₁ = $20 and W₂ = $18,and the market is always in equilibrium.A shift of the labor supply curve from S₁ to S₂ would
A) increase the value of the marginal product of labor by $2.
B) decrease the value of the marginal product of labor by $2.
C) decrease the value of the marginal product of labor by more than $2.
D) not change the value of the marginal product of labor.
Correct Answer:
Verified
Q46: What happens to labor supply in the
Q143: Scenario 18-5
Suppose that workers from northern Minnesota,
Q144: Scenario 18-4
In 1997, Albania experienced a civil
Q157: Scenario 18-5
Suppose that workers from northern Minnesota,
Q162: Consider the market for university economics professors.
Q187: When a labor market experiences a surplus
Q188: Suppose that the market for labor is
Q190: When labor supply increases,
A)the marginal productivity of
Q267: Figure 18-7 Q269: Figure 18-7
![]()
![]()
Unlock this Answer For Free Now!
View this answer and more for free by performing one of the following actions

Scan the QR code to install the App and get 2 free unlocks

Unlock quizzes for free by uploading documents