Multiple Choice
Figure 20-2
Number of Poor
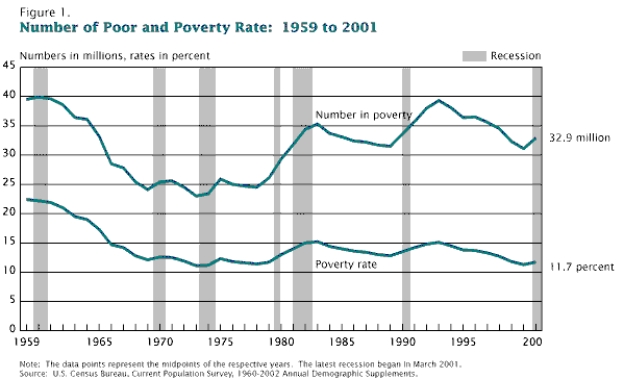
-Refer to Figure 20-2.Between 1965 and 2001,during recessions (the shaded bars) the number of individuals in poverty has
A) increased.
B) decreased.
C) not changed.
D) decreased and then increased.
Correct Answer:
Verified
Related Questions
Q91: Figure 20-3 Q93: The distribution of income for Grim is Q94: The distribution of income for Danville is Q95: The poverty line in the country of Unlock this Answer For Free Now! View this answer and more for free by performing one of the following actions Scan the QR code to install the App and get 2 free unlocks Unlock quizzes for free by uploading documents
Panel A
![]()

