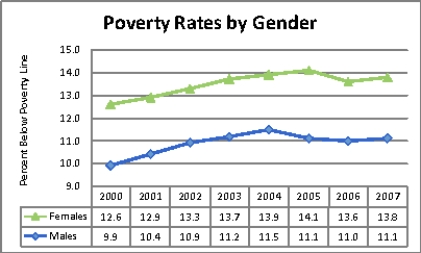
Figure 20-3
Panel A
Source: U.S. Bureau of the Census
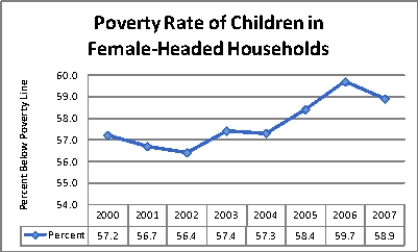
Panel B
Source: U.S. Bureau of the Census
-Refer to Figure 20-3.Panel B focuses on children who live in female-headed households.It illustrates the percentage of those children who live in poverty.For example,in 2000,slightly over 57 percent of all children who lived in a female-headed household lived below the poverty line.How is this information related to the graph illustrated in Panel A?
A) The high prevalence of poverty in households headed by women is inversely related to male poverty rates.
B) The poverty rates shown in Panel B are found by multiplying the female poverty rates shown in Panel A by 450%.
C) The high prevalence of poverty in households headed by women likely explains why female poverty rates are higher than male poverty rates.
D) Both b and c are correct.
Correct Answer:
Verified
Q94: The distribution of income for Danville is
Q95: The poverty line in the country of
Q96: Figure 20-2 Q97: Figure 20-2 Q100: The poverty line in the country of Q101: Table 20-9 Q264: The percentage of families with incomes below Q304: The poverty line is adjusted each year Q311: Which of the following statements is correct? Q312: Measuring poverty using an absolute income scale
Number of Poor
![]()
Number of Poor
![]()
Poverty Thresholds in 2002, by Size
A)The
Unlock this Answer For Free Now!
View this answer and more for free by performing one of the following actions

Scan the QR code to install the App and get 2 free unlocks

Unlock quizzes for free by uploading documents