Multiple Choice
Figure 21-18
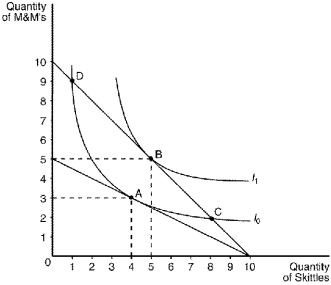
-Refer to Figure 21-18.Assume that the consumer depicted in the figure faces prices and income such that she optimizes at point B.According to the graph,which of the following would cause the consumer to move to point A?
A) a decrease in the price of Skittles
B) a decrease in the price of M&M's
C) an increase in the price of Skittles
D) an increase in the price of M&M's
Correct Answer:
Verified
Related Questions
Q200: Suppose Rich always uses two packets of
Q201: Figure 21-17
![]()

