Figure 21-19 The Following Graph Illustrates a Representative Consumer's Preferences for Marshmallows
Figure 21-19
The following graph illustrates a representative consumer's preferences for marshmallows and chocolate chip cookies:
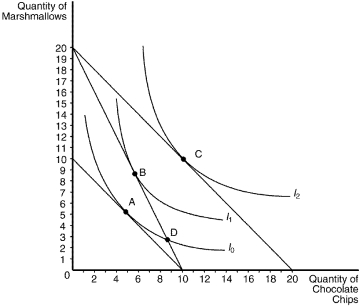
-Refer to Figure 21-19.Assume that the consumer has an income of $80.If the price of chocolate chips is $4 and the price of marshmallows is $4,the optimizing consumer would choose to purchase
A) 9 marshmallows and 6 chocolate chips.
B) 10 marshmallows and 10 chocolate chips.
C) 5 marshmallows and 5 chocolate chips.
D) 3 marshmallows and 9 chocolate chips.
Correct Answer:
Verified
Q141: The goal of the consumer is to
A)maximize
Q151: A consumer chooses an optimal consumption point
Q157: When a consumer is purchasing the best
Q164: An optimizing consumer will select a consumption
Q172: Bundle J contains 10 units of good
Q180: If the consumer's income and all prices
Q222: Casey consumes two goods,hamburgers and ice cream
Q223: Figure 21-19
The following graph illustrates a representative
Q224: The relationship between the marginal utility that
Q225: Figure 21-19
The following graph illustrates a representative
Unlock this Answer For Free Now!
View this answer and more for free by performing one of the following actions

Scan the QR code to install the App and get 2 free unlocks

Unlock quizzes for free by uploading documents