Consider the figure below . Which of the following will cause a shift in the aggregate demand curve from AD 1 to AD 2 ?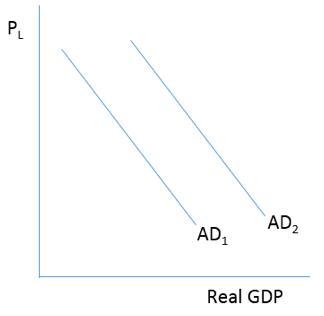
A) An increase in personal savings
B) An increase in personal income taxes
C) A reduction in personal income taxes
D) Increased consumer pessimism about the future
Correct Answer:
Verified
Q14: Consider the figure below. Which of the
Q15: The Keynesian aggregate supply model does not
Q16: In which of the following situations did
Q17: Keynes suggested that what kind of spending
Q18: The Pigou effect is one of the
Q20: Which of these would cause a decrease
Q21: Several factors can cause the SRAS curve
Q22: Consider the figure below . A decrease
Q23: When resource markets are efficient, recessionary gaps
Q24: Consider the figure below . If the
Unlock this Answer For Free Now!
View this answer and more for free by performing one of the following actions

Scan the QR code to install the App and get 2 free unlocks

Unlock quizzes for free by uploading documents