Consider the figure below . Which of the following would cause a shift in the aggregate demand curve from AD 1 to AD 2 ?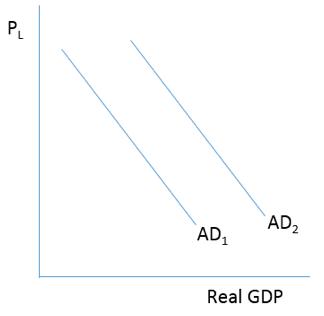
A) An increase in federal government spending on Social Security
B) An increase in federal government spending on drones
C) A decrease in federal government spending on highway infrastructure
D) A decrease in state government spending
Correct Answer:
Verified
Q3: Which of these statements best explains the
Q4: It is found that when the disposable
Q5: Aggregate demand is equal to
A)C + I
Q6: Originally, Keynes conceived of the aggregate supply
Q7: At the time of the Great Depression,
Q9: The relationship between the economy-wide price level
Q10: Economic theorists expanded on the Keynesian aggregate
Q11: In the country of Trivia, it is
Q12: Using a two-part aggregate supply curve, an
Q13: According to Keynes, when the price level
Unlock this Answer For Free Now!
View this answer and more for free by performing one of the following actions

Scan the QR code to install the App and get 2 free unlocks

Unlock quizzes for free by uploading documents