The following graphs show what occurs during a flight to quality for the loanable funds market for T-bills (left) and the market for investment grade bonds (right) . 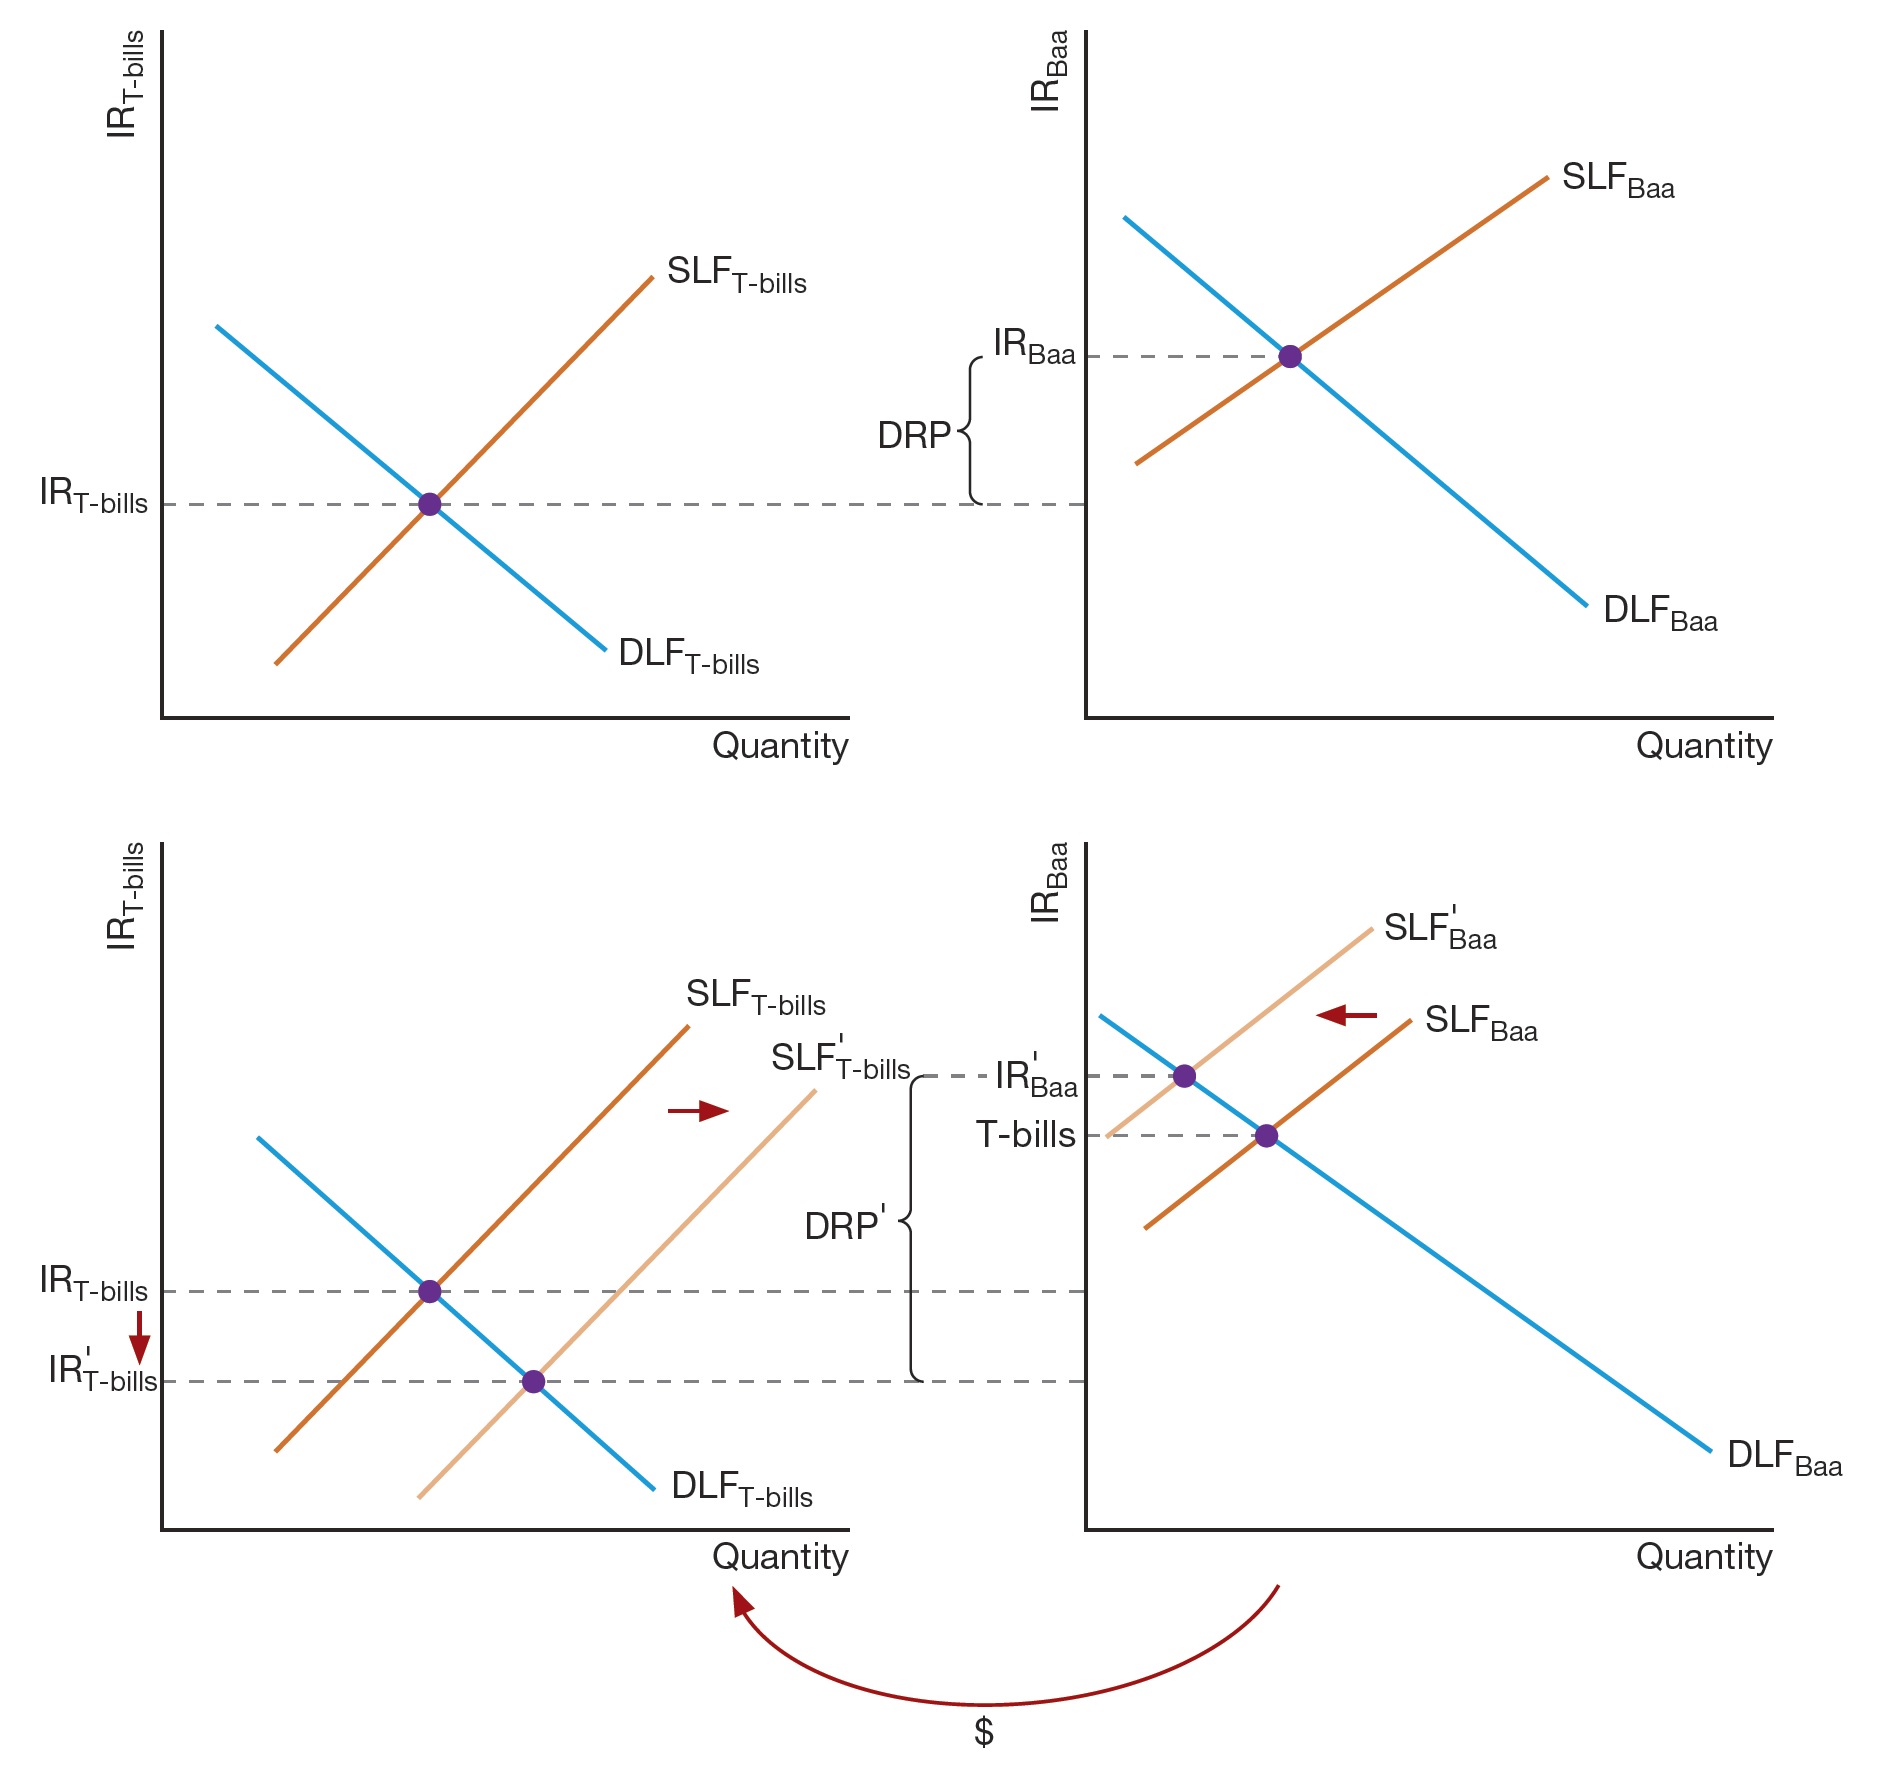
Based on the information presented in the graphs, which of the following statements is true?
A) As a result of the flight to quality, the interest rate in the Baa market increases, while the interest rate in the T-bill market falls.
B) As a result of the flight to quality, there is an increase in the supply of loanable funds in the Baa market.
C) As a result of the flight to quality, there is an increase in the supply of loanable funds in the both the T-bill market and the Baa market.
D) As a result of the flight to quality, there is an increase in the demand of loanable funds in the Baa market.
Correct Answer:
Verified
Q16: Kayla recently inherited a substantial sum of
Q17: B&G Corporation issues convertible bonds. Convertible bonds
Q18: The local government of Clintonville wants to
Q19: Which of these best describes how bond-rating
Q20: ABC Manufacturing Corporation has an AA bond
Q22: A saver is trying to decide whether
Q23: How did a change in the business
Q24: Which of the following is true of
Q25: During a flight to quality, the default
Q26: Which of the following markets were hard
Unlock this Answer For Free Now!
View this answer and more for free by performing one of the following actions

Scan the QR code to install the App and get 2 free unlocks

Unlock quizzes for free by uploading documents