Exhibit 19-1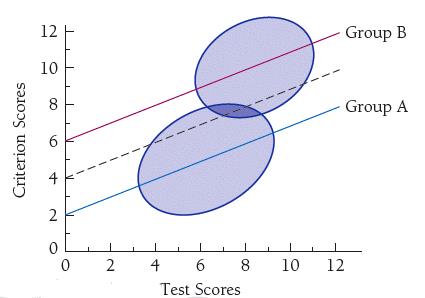
Refer to Exhibit 19-1. In the above figure, a test score of 6 is associated with a criterion score of approximately ____ for Group A and ____ for Group B.
A) 5; 9
B) 5; 5
C) 6; 6
D) 8; 6
Correct Answer:
Verified
Q5: _ attempts to identify items that are
Q6: Over the last decade, SAT scores have
Q7: A test has adverse impact if it
A)decreases
Q8: Flaugher (1978)contends that arguments about test bias
Q9: Examination of tests such as the WAIS
Q11: African American children significantly outperform white children
Q12: The real dispute about racial differences in
Unlock this Answer For Free Now!
View this answer and more for free by performing one of the following actions

Scan the QR code to install the App and get 2 free unlocks

Unlock quizzes for free by uploading documents