Figure 9-2 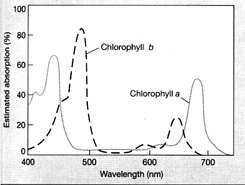
According to the graph in the accompanying figure, chlorophyll absorbs light most strongly in what region of the electromagnetic spectrum?
A) UV and red wavelengths
B) Red and blue wavelengths
C) Blue and green wavelengths
D) Green and yellow wavelengths
E) UV and infrared wavelengths
Correct Answer:
Verified
Q1: Which part of the chlorophyll molecule is
Q2: Which of these absorbs light primarily in
Q3: Figure 9-1 Q5: The action spectrum of photosynthesis best matches Q6: What happens in the second phase of Q7: When an electron returns to its ground![]()
Unlock this Answer For Free Now!
View this answer and more for free by performing one of the following actions

Scan the QR code to install the App and get 2 free unlocks

Unlock quizzes for free by uploading documents