Multiple Choice
Figure 46-4 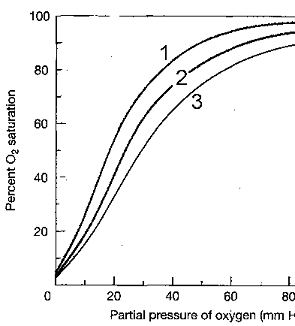
Oxygen-hemoglobin dissociation curves at three different pH levels
The phenomenon illustrated in the accompanying figure is known as:
A) carbon dioxide unloading.
B) the Bohr effect.
C) hemoglobin transportation.
D) chloride shift.
E) residual capacity.
Correct Answer:
Verified
Related Questions
Q34: Figure 46-2 Q35: Figure 46-1 Q36: Fick's law states that: Q37: Hemocyanin: Unlock this Answer For Free Now! View this answer and more for free by performing one of the following actions Scan the QR code to install the App and get 2 free unlocks Unlock quizzes for free by uploading documents![]()
![]()
A) the amount of
A) combines irreversibly with oxygen for transport

