Multiple Choice
Figure 53-5 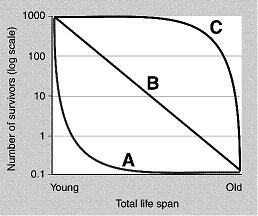
Refer to the accompanying figure. How would the survivorship curve for elephants be represented?
A) The curve A
B) The curve B
C) The curve C
D) Either A or C, depending on the species
E) Elephant populations would be better represented by a curve falling between A and B.
Correct Answer:
Verified
Related Questions
Q21: The growth rate of a population is
Q22: Which of the following is an INCORRECT
Q23: An example of a density-dependent factor that
Unlock this Answer For Free Now!
View this answer and more for free by performing one of the following actions

Scan the QR code to install the App and get 2 free unlocks

Unlock quizzes for free by uploading documents