Figure 53-6 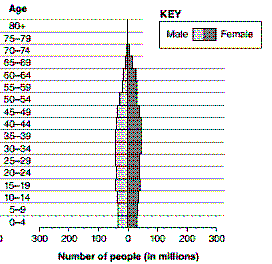 Figure 53-6 represents the age structure diagram of:
A) the transition stage.
B) the preindustrial state.
C) a moderately developed country.
D) a developing country.
E) a highly developed country.
Correct Answer:
Verified
Q42: A human population that is shrinking would
Q43: Organisms such as oysters or fish that
Q52: Tawny owls (Strix aluco) pair-bond for life,
Q53: What British clergyman and economist was one
Q54: Surplus individuals in the _ disperse and
Q56: Less-developed countries are most likely to be
Q59: _ are good habitats where local reproductive
Q60: In a population characterized by type III
Q71: Territoriality often results in clumped dispersion.
Q75: A killing frost is an example of
Unlock this Answer For Free Now!
View this answer and more for free by performing one of the following actions

Scan the QR code to install the App and get 2 free unlocks

Unlock quizzes for free by uploading documents