Figure 9-2 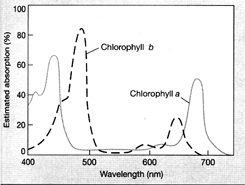 The graph in the accompanying figure represents the:
A) electromagnetic spectrum
B) action spectrum of photosynthesis
C) process of cyclic electron transport
D) process of noncyclic electron transport
E) absorption spectra for chlorophylls a and b
Correct Answer:
Verified
Q5: The action spectrum of photosynthesis best matches
Q6: Figure 9-1 Q8: When an electron returns to its ground Q9: What color does chlorophyll reflect? Q10: What is the fluid-filled sac within the Q11: An electron absorbs a photon of light Q13: By definition, substances that absorb visible light Q13: Why does red and blue light support Q14: Which type of electromagnetic waves have the Q16: In what part of a chloroplast are![]()
A) red
B) blue
C)
Unlock this Answer For Free Now!
View this answer and more for free by performing one of the following actions

Scan the QR code to install the App and get 2 free unlocks

Unlock quizzes for free by uploading documents