Multiple Choice
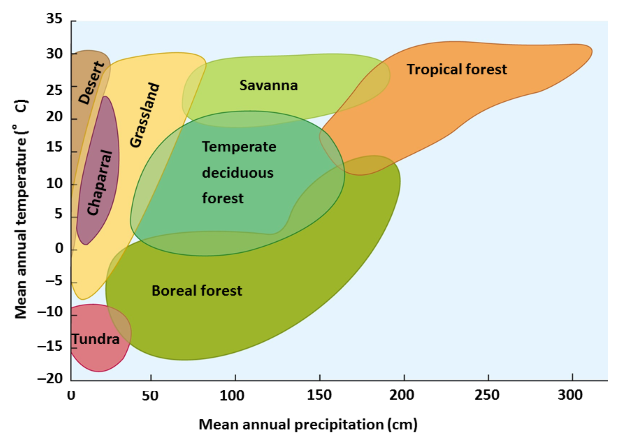
Answer the question using the accompanying figure. According to the graph, the upper mean annual temperature for boreal forests is approximately ____ o C .
A) -7
B) 2
C) 15
D) 25
E) 35
Correct Answer:
Verified
Related Questions
Q4: Expanding air masses _.
A) sink
B) rise
C) are
Q7: Cool, dry air descends at which latitude?
A)
Q9: Adiabatic cooling takes place when _.
A) latitudinal
Q25: Which biome experiences the dryest and warmest
Unlock this Answer For Free Now!
View this answer and more for free by performing one of the following actions

Scan the QR code to install the App and get 2 free unlocks

Unlock quizzes for free by uploading documents