In a sample of a nearly ideal gas, this graph could represent a plot of
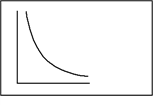
A) Boyle's law, V vs. T at a given constant P.
B) Charles's law, P vs. T at a given constant V.
C) Boyle's law, P vs. V at a given constant T.
D) Dalton's law, PV vs. P at a given constant T.
E) Avogadro's law, P vs. n at a constant T.
Correct Answer:
Verified
Q1: What causes pressure?
A)Constant small fluctuations in temperature
B)Collisions
Q2: The layer of air which surrounds the
Q3: Pressure is defined as:
A)force times unit area.
B)mass
Q6: Which of these is not a possible
Q7: Which of these is not a possible
Q8: According to Boyle's law, if the pressure
Q9: A balloon contains 14.0 L of air
Q10: What is the correct conversion factor between
Q11: Which of these is the correct representation
Q17: Which of these is the correct representation
Unlock this Answer For Free Now!
View this answer and more for free by performing one of the following actions

Scan the QR code to install the App and get 2 free unlocks

Unlock quizzes for free by uploading documents