Table 3-2 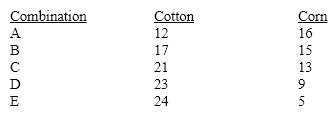 The concept of opportunity cost can be represented graphically by the
A) area inside the production possibilities frontier.
B) slope of the production possibilities frontier.
C) vertical distance from the horizontal axis to the production possibilities frontier.
D) horizontal distance from the vertical axis to the production possibilities frontier.
E) sum of the horizontal and vertical distances to the production possibilities frontier.
Correct Answer:
Verified
Q165: Table 3-1 Q166: The shape of the production possibilities frontier Q167: The production possibilities frontier in Figure 3-1, Q167: Table 3-2 Q168: If production involves decreasing opportunity cost, the Q172: A production possibilities frontier has a downward Unlock this Answer For Free Now! View this answer and more for free by performing one of the following actions Scan the QR code to install the App and get 2 free unlocks Unlock quizzes for free by uploading documents![]()
![]()

