Multiple Choice
Figure 3-5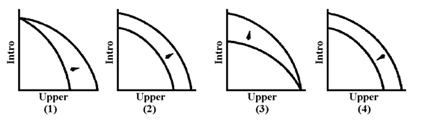
At present, faculty in the Economics Department teach introductory and upper-level courses. Which graph in Figure 3-5 represents the change in the production possibilities of the Economics Department after a policy of using graduate students in addition to faculty to teach introductory sections was implemented?
A) 1
B) 2
C) 3
D) 4
Correct Answer:
Verified
Related Questions
Q190: Figure 3-2 Q202: What would be the opportunity cost of Unlock this Answer For Free Now! View this answer and more for free by performing one of the following actions Scan the QR code to install the App and get 2 free unlocks Unlock quizzes for free by uploading documents![]()

