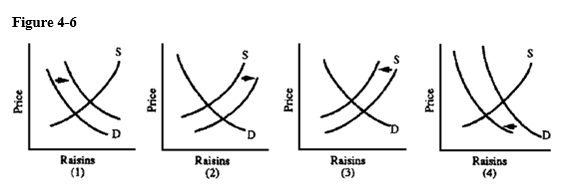
 Grapes can be used to produce wine or raisins. Which graph in Figure 4-6 best depicts the effects on the U.S. raisin market of a decline in purchases of domestic wine?
A) 1
B) 2
C) 3
D) 4
Correct Answer:
Verified
Q206: The supply curve of books (which are
Q207: Higher steel prices will result in a
Q212: Professional baseball teams in the United States
Q213: A severe freeze has damaged the Florida
Q215: Two studies published in the New England
Q217: American consumers learn that grape consumption can
Q221: Q222: If both the supply and demand curves Q224: University studies have shown that that chickens Q225: ![]()
![]()
Unlock this Answer For Free Now!
View this answer and more for free by performing one of the following actions

Scan the QR code to install the App and get 2 free unlocks

Unlock quizzes for free by uploading documents