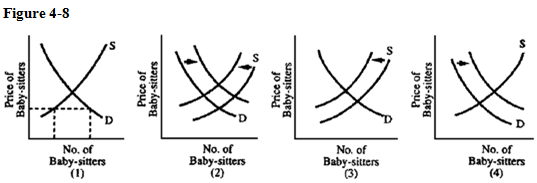
Families are having more children than families did 15 years earlier. As a result, families have more trouble finding baby-sitters and are shocked at the cost of child care. Which graph in Figure 4-8 best illustrates how the situation has changed?
A) 1
B) 2
C) 3
D) 4
Correct Answer:
Verified
Q202: The supply curve of books (which are
Q203: The quantity of newspapers sold will decline
Q204: Suppose we are considering the milk market
Q208: The change in the amount of a
Q210: The development of new technology reduces the
Q215: In January, 2,500 quarts of ice cream
Q216: The following price-quantity coordinates for gold used
Q218: Pork can be used to produce bacon
Q219: Professional baseball teams in the United States
Q220: The invention of new technology that can
Unlock this Answer For Free Now!
View this answer and more for free by performing one of the following actions

Scan the QR code to install the App and get 2 free unlocks

Unlock quizzes for free by uploading documents