Multiple Choice
Figure 8-1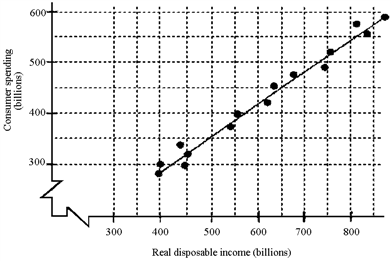
Given the scatter diagram in Figure 8-1, what is the MPC (your best estimate) ?
A) 1/2
B) 1/3
C) 2/3
D) 1
Correct Answer:
Verified
Related Questions
Q81: If disposable income rises by $100 billion,
Q83: The federal government's principal tool in altering
Q84: If an economist wants to make a
Q85: The relationship between consumer spending and disposable
Unlock this Answer For Free Now!
View this answer and more for free by performing one of the following actions

Scan the QR code to install the App and get 2 free unlocks

Unlock quizzes for free by uploading documents