Figure 10-1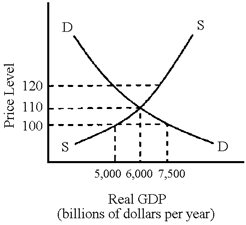
In Figure 10-1, what is the equilibrium level of real GDP and equilibrium price?
A) $6,000 billion real GDP and price level of 110
B) $5,000 billion real GDP and price level of 120
C) $5,000 billion real GDP and price level of 110
D) $7,500 billion real GDP and price level of 100
Correct Answer:
Verified
Q101: The only factor that can cause movement
Q103: In response to the demands of environmentalists,
Q106: The typical movement of the aggregate supply
Q108: If the prices of inputs change, what
Q113: Educational reforms that result in improved reading
Q117: If aggregate quantity supplied exceeds aggregate quantity
Q119: The aggregate demand and aggregate supply curve
Q120: If money wages increase, the most likely
Q120: Figure 10-1 Q121: Figure 10-3![]()
![]()
Unlock this Answer For Free Now!
View this answer and more for free by performing one of the following actions

Scan the QR code to install the App and get 2 free unlocks

Unlock quizzes for free by uploading documents