Figure 10-4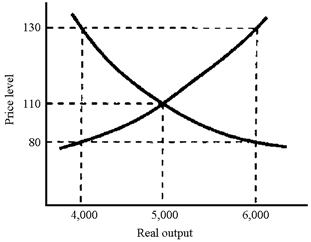
In Figure 10-4, if full employment occurs at 5,000 and the price level is currently 130, then we can expect the
A) aggregate supply curve to shift to the left until a new equilibrium is established at an output level of 4,000.
B) aggregate demand curve to shift to the right until a new equilibrium is established at an output level of 6,000.
C) price level to fall to 110.
D) aggregate demand to shift to the left and aggregate supply to shift to the right until the price level reaches 130.
Correct Answer:
Verified
Q125: According to an old saying, when too
Q134: Figure 10-2 Q135: The federal government increases spending by $50 Q138: Figure 10-2 Q141: An inflationary gap will exist when Q144: Most economists agree that the economy will Unlock this Answer For Free Now! View this answer and more for free by performing one of the following actions Scan the QR code to install the App and get 2 free unlocks Unlock quizzes for free by uploading documents
![]()
![]()
A)aggregate demand

