Multiple Choice
Figure 10-5 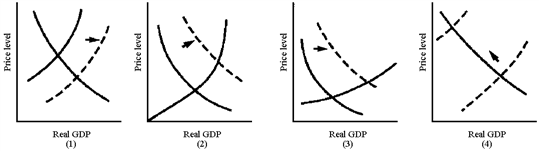
In Figure 10-5, which graph best illustrates the situation of an economy near full employment that experiences an increase in autonomous consumer spending?
A) (1)
B) (2)
C) (3)
D) (4)
Correct Answer:
Verified
Related Questions
Q173: The example of an inflationary gap in
Q174: Which of the following situations would cause
Q182: How are aggregate supply and stagflation related?
A)Stagflation

