Multiple Choice
Figure 10-5 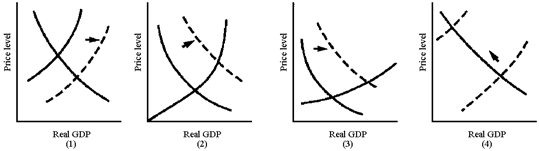
In Figure 10-5, which graph best illustrates the situation of an economy reacting to an inflationary gap through an increase in wage levels?
A) (1)
B) (2)
C) (3)
D) -(4)
Correct Answer:
Verified
Related Questions

