Figure 10-5 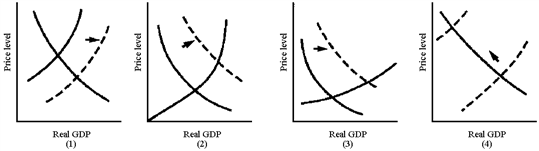
In Figure 10-5, which graph best illustrates the situation of an economy reacting to a recessionary gap by reducing resource cost levels?
A) (1)
B) (2)
C) (3)
D) (4)
Correct Answer:
Verified
Q185: The years 2002 through 2007 can be
Q186: The usual results of an adverse supply
Q187: The self-correcting mechanism would be expected to
Q188: Figure 10-6 Q188: Figure 10-6 Q189: The 2002-2008 OPEC price increases caused by Q191: Which of the following events will lead Q192: A outward shift of the aggregate supply Q196: During 2008-2010, the U.S.economy showed signs of Q197: Figure 10-5 Unlock this Answer For Free Now! View this answer and more for free by performing one of the following actions Scan the QR code to install the App and get 2 free unlocks Unlock quizzes for free by uploading documents![]()
![]()
![]()

