Multiple Choice
Figure 10-8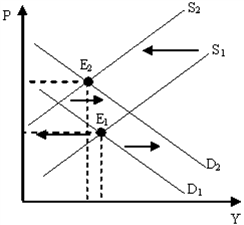
Figure 10-8 illustrates a period of
A) low unemployment and high inflation.
B) low unemployment and low inflation.
C) high unemployment and high inflation.
D) high unemployment and low inflation.
Correct Answer:
Verified
Related Questions
Q201: Figure 10-7 Q203: Figure 10-9 Q204: Figure 10-7 Q204: The fact that severe fluctuations in inflation Q205: Figure 10-7 Q208: Figure 10-7 Q209: Figure 10-9 Q212: From the mid-1980s until late 2007, many Q213: Figure 10-9 Q216: Distinguish between a movement along the aggregate Unlock this Answer For Free Now! View this answer and more for free by performing one of the following actions Scan the QR code to install the App and get 2 free unlocks Unlock quizzes for free by uploading documents![]()
![]()
![]()
![]()
![]()
![]()
![]()

