Multiple Choice
Figure 11-3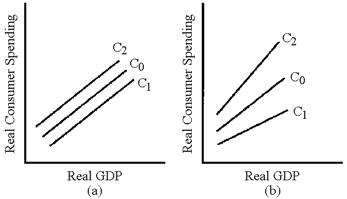
In Figure 11-3, which line represents the change in the consumption schedule caused by an increase in the residential property tax?
A) C1 in graph (a)
B) C2 in graph (a)
C) C1 in graph (b)
D) C2 in graph (b)
Correct Answer:
Verified
Related Questions
Q182: As a general rule, when an income

