Multiple Choice
Figure 34-5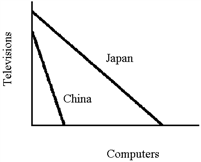
From the graph in Figure 34-5 (curves show output per unit of labor input) , one can infer that
A) in terms of TVs, computers are more expensive in China than Japan.
B) in terms of computers, TVs are more expensive in China than Japan.
C) China should produce more TVs and fewer computers.
D) All of the above are correct.
Correct Answer:
Verified
Related Questions

