Figure 19-1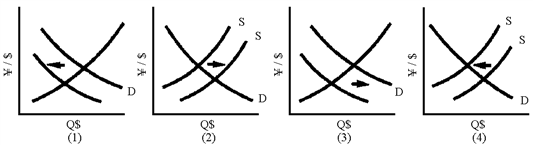
Of the graphs in Figure 19-1, which one shows that an expansion of the Japanese economy leads to a depreciation of the yen?
A) 1
B) 2
C) 3
D) 4
Correct Answer:
Verified
Q42: If inflation in the United States is
Q104: An economic boom in the United States
Q107: The idea behind the "Big Mac index"
Q111: One major reason why the purchasing power
Q114: If nations erect tariffs and quotas to
Q115: If Wisconsin cheddar cheese sells for $3.00
Q116: A recession in the United States will
Q117: Exchange rates in what is termed the
Q118: If the United States experiences an economic
Q119: Figure 19-1![]()
Unlock this Answer For Free Now!
View this answer and more for free by performing one of the following actions

Scan the QR code to install the App and get 2 free unlocks

Unlock quizzes for free by uploading documents