Multiple Choice
Figure 19-1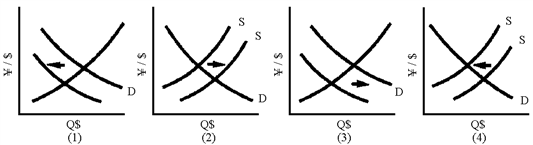
Of the graphs in Figure 19-1, which one shows the effects of an increase in interest rates in Japan and a depreciation of the dollar?
A) 1
B) 2
C) 3
D) 4
Correct Answer:
Verified
Related Questions
Q8: The prospect of a recession in the
Q54: If the U.S.purchases oil from Venezuela,what is
Q58: If a Mexican pension fund decides to
Q86: The purchasing power parity theory of exchange
Q87: If exchange rates are determined in a
Q97: In the long run, the chief determinant
Unlock this Answer For Free Now!
View this answer and more for free by performing one of the following actions

Scan the QR code to install the App and get 2 free unlocks

Unlock quizzes for free by uploading documents