Figure 36-5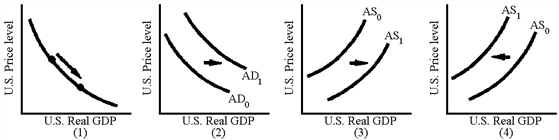
Which of the graphs in Figure 36-5 are consistent with a depreciation of the U.S. dollar and an increase in net exports caused by a decrease in U.S. interest rates?
A) 1
B) 2
C) 3
D) 4
Correct Answer:
Verified
Q104: For a major country with extensive capital
Q107: A decline in interest rates tends to
Q109: The anticipated effect of contractionary monetary policy
Q113: A currency depreciation
A)reduces aggregate demand and increases
Q115: International trade tends to lower the value
Q116: International capital flows are purchases and sales
Q121: Why is fiscal policy less effective in
Unlock this Answer For Free Now!
View this answer and more for free by performing one of the following actions

Scan the QR code to install the App and get 2 free unlocks

Unlock quizzes for free by uploading documents