Exhibit 1-2 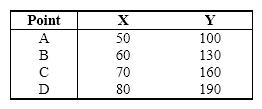 Refer to Exhibit 1-2. According to the data provided in this table, what is the slope of the line between points C and D, if these data were graphed with X on the horizontal axis and Y on the vertical axis?
A) -3.00
B) -0.33
C) 3.00
D) 0.33
E) 1.00
Correct Answer:
Verified
Q111: In general,there is a _ relationship between
Q112: Which of the following statements is false?
A)
Q115: Saying "the marginal costs are greater than
Q116: The _ the opportunity cost of doing
Q120: What does it mean if a person
Q121: To an economist,utility means:
A) additional.
B) usefulness.
C) satisfaction.
D)
Q124: Exhibit 1-1 Q126: Variables A and B are directly related.![]()
Unlock this Answer For Free Now!
View this answer and more for free by performing one of the following actions

Scan the QR code to install the App and get 2 free unlocks

Unlock quizzes for free by uploading documents