Exhibit 1-2 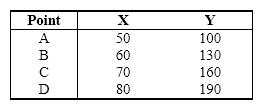 Refer to Exhibit 1-2. Based on the data provided in this table, if these data were plotted in a two-variable diagram the result would be ______________ sloping ____________________.
A) a downward; (nonlinear) curve
B) a downward; (straight) line
C) an upward; (nonlinear) curve
D) an upward; (straight) line
Correct Answer:
Verified
Q129: Q130: Exhibit 1-2 Q131: Exhibit 1-3 Q132: Exhibit 1-1 Q133: The answer is, "This is principally used Q136: In a two-variable diagram, there is a Q138: Which of the following is the best Q139: In a two-variable diagram, there is a Q140: According to economists,competition exists because of Q140: A characteristic of a 45-degree line is Unlock this Answer For Free Now! View this answer and more for free by performing one of the following actions Scan the QR code to install the App and get 2 free unlocks Unlock quizzes for free by uploading documents![]()
![]()
![]()
![]()
A) scarcity.
B)

