Multiple Choice
Exhibit 1-3 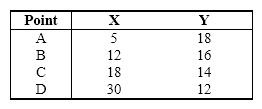 Refer to Exhibit 1-3. According to the data provided in this table, what is the approximate slope of the line between points A and B, if these data were graphed with X on the horizontal axis and Y on the vertical axis?
A) -0.29
B) -3.50
C) 0.29
D) 3.50
E) -1.00
Correct Answer:
Verified
Related Questions
Q139: In a two-variable diagram, there is a
Q140: A characteristic of a 45-degree line is
Q142: A theory
A)is built on the major factors
Q145: Which statement uses the term ceteris paribus
Unlock this Answer For Free Now!
View this answer and more for free by performing one of the following actions

Scan the QR code to install the App and get 2 free unlocks

Unlock quizzes for free by uploading documents