Exhibit 1-3 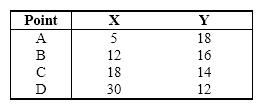 Refer to Exhibit 1-3. Based on the data provided in this table, if these data were plotted in a two-variable diagram the result would be a ______________ sloping _____________.
A) downward; (nonlinear) curve
B) downward; (straight) line
C) upward; (nonlinear) curve
D) upward; (straight) line
Correct Answer:
Verified
Q141: If an economist says "the higher the
Q142: Economists use the ceteris paribus assumption primarily
Q143: Which of the following is not one
Q150: Which of the following statements uses the
Q154: Ceteris paribus means
A) "one variable too many."
B)
Q156: The purpose of the ceteris paribus assumption
Unlock this Answer For Free Now!
View this answer and more for free by performing one of the following actions

Scan the QR code to install the App and get 2 free unlocks

Unlock quizzes for free by uploading documents