Multiple Choice
Exhibit 2-6 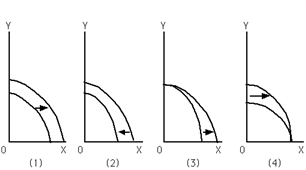
Refer to Exhibit 2-6. Which graph depicts the result of an increase in the unemployment rate?
A) (1)
B) (2)
C) (3)
D) (4)
E) The result of an increase in the unemployment rate is not depicted by any of the graphs shown here.
Correct Answer:
Verified
Related Questions

